Read This Before Getting Started for Your Tableau Data Visualization

I am an Infromation System for Business student and have always been doing on Matplotlib, Seaborn, and Plotly for all of my visualizations in pyhton (C’mon, we all do, right?). To me, lengthy Python codes were really cool, but drag-and-drop plots were not. Now just imagine, if any of products team from the industry need some data visualizations, then the Business Intelligence team comes to the rescue. I’ve been learning neither Tableau nor PowerBI for about one year and i always ended up with creating a dashboard with findings for a few business questions, and shared them to my friends and lecturers.
The why
From my experience, I learned that having a strong “why” is a crucial first step, as it helps us drive towards achieving the goal no matter the obstacles.
Find out your “why” first. It is the purpose, cause or belief that drives every one of us.
To give you a bit of context, I was doing for a project analyzing the shipping service of an e-commerce during COVID-19. For this project, we had to unify our modelings and findings to deliver to the stake-holders. And in the end, it was decided that we go ahead with Tableau since it offers interactive world-class visualizations and most collaborators were comfortable with it.
The “why” differs from person to person. You might want to add the Tableau weapon to your data science armor. Or you might want to be able to produce stellar visualizations with minimal code. You might even have a Tableau assignment given out to you during your interview by your dream company. Understand your “why” first and proceed.
The how
I wasted no time in getting started. I downloaded the Tableau Desktop version then signing up for the student account (this is a small tip for you who wants to get the access for free in one year) and installed it right away. Having the software on my laptop helps me get hands-on while learning.
Next, I explored some options for Tableau beginner tutorials. After spending some time researching, I found the official tutorial by Tableau extremely useful. The entire getting-started tutorial had step-by-step guidance in text form and was easy to understand (Yes, text tutorial!). The beauty of this was, it lets us skim through the complete tutorial in a couple of hours, understand the complete workflow, and use it as required.
The what
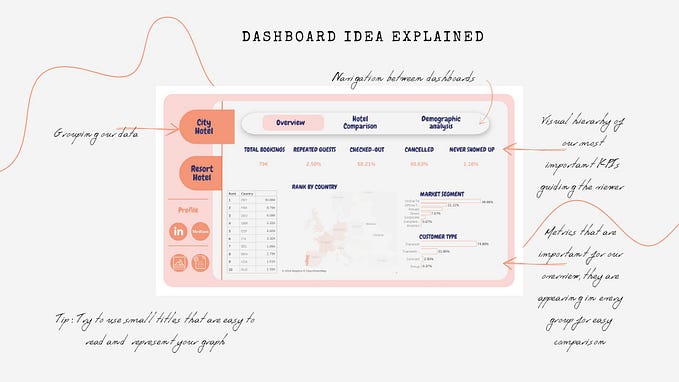
So what did I create? My goal was to understand the patterns of e-commerce shipping service during the COVID-19. I created a basic interactive dashboard that conveys these summarized statistics at a glance and gives the stakeholders an understanding of shipping service situation to improving the quality of the shipping service.
It is important to have an idea of what you want to create. Create a stellar visualization to add to your data science portfolio? Or maybe you want to create basic plots to communicate your findings? You (must) decide your “what.”
Recap
Being able to create classy visualizations with drag-and-drop is cool too. We need to have an open mind and excel in the art of using the best tool as the situation demands. If you’ve got a couple of days in hand, here’s my recap of what worked for me to get started with Tableau, broken down into steps.
- Download Tableau Desktop version (even the free public version is fine)
- You probably have your own data; if not, browse through these datasets and pick one that is of interest.
- Write down 3 business/research questions that you would like to analyze.
- Learn Tableau with those goals in mind
- Create a dashboard analyzing the data and answering those questions
- Share it with the world!
Looking back now, I realized I didn’t just learn Tableau, but I learned how to tackle down a task within a limited time.
Understanding the “why”, the “how”, and the “what” upfront, helps you learn with a purpose and create value.
It might seem obvious when you read it, but most of the time, we forget to apply this when we try to solve real-world problems.
Thank you for reading this far. I hope this article added some value to you and helped you get started with Tableau. and don’t forget to clap on this article if you find it useful! Happy Learning :)